Task 2: Use JPMorgan Chase frameworks and tools
Background
Typically, traders monitor stock prices and trading strategies by having data displayed visually on their screens in chart form. Often these charts will be accompanied by alerts that notify users when certain events occur or when preset price thresholds are hit.
JPMorgan Chase created the Perspective tool over many years to allows users to present and manipulate data feeds visually in web applications.
Perspective provides a set of flexible data transforms, such as pivots, filters, and aggregations. It utilizes bleeding-edge browser technology such as Web Assembly and Apache Arrow and is unmatched in browser performance. It is engineered for reliability and production-vetted on the JPMorgan Chase trading floor and is now available to the development community as Open Source. Chect it out on github page of perspective.
Set Up
1 | xiaxii@cecilias-mbp JPMC % git --version |
1 | xiaxii@cecilias-mbp JPMC-tech-task-2-PY3 % ls |
Server
1 | xiaxii@cecilias-mbp JPMC-tech-task-2-py3 % python3 datafeed/server3.py |
Client
1 | xiaxii@cecilias-mbp JPMC-tech-task-2-PY3 % curl -o- https://raw.githubusercontent.com/creationix/nvm/v0.33.0/install.sh | bash |
First Run
1 | npm install |
Result
Troubleshooting
Error: type error: Cannot find module ‘@jpmorganchase/perspective’. TS2307
Solution:
go to the your project directory and just type the command:1
npm i @finos/perspective
this will install the required files in your project directory
and then goto your graph.tsx file and replace1
import { Table } from '@jpmorganchase/perspective';
with this below code1
import { Table } from '@finos/perspective';
Ref: https://github.com/insidesherpa/JPMC-tech-task-2/issues/47
Code Changes
Prerequest
the app can run after npm start.
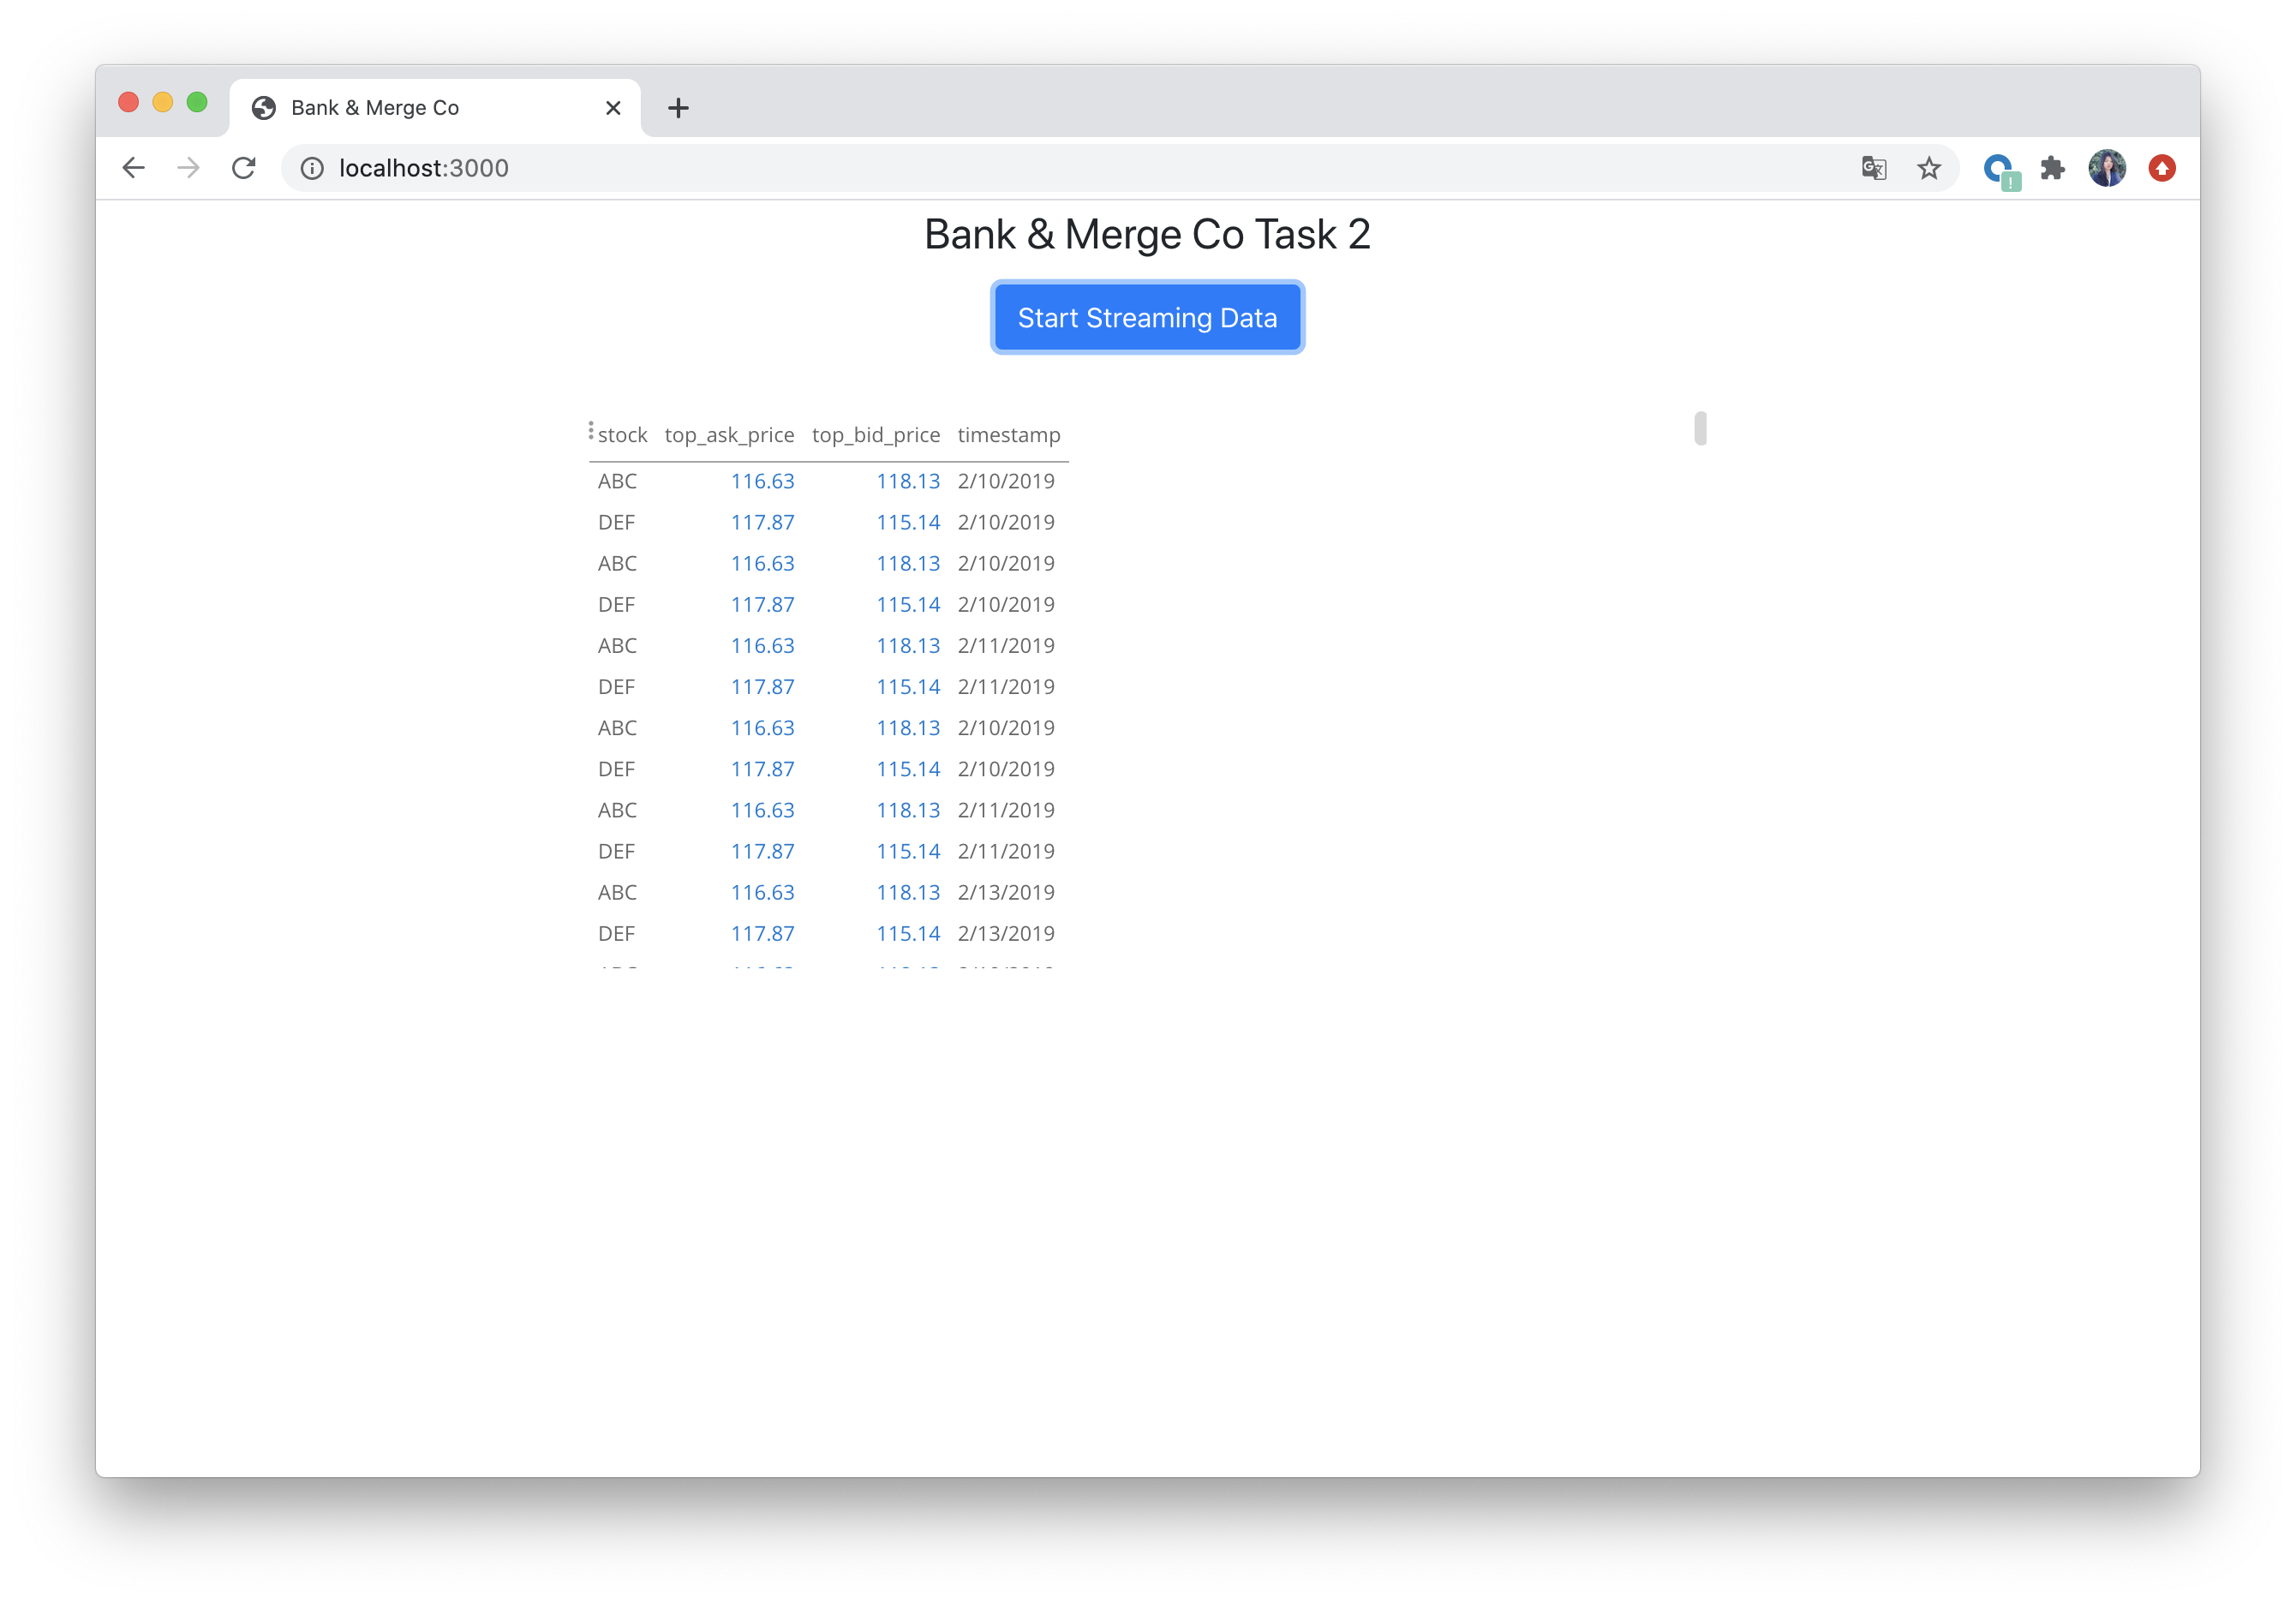
(1) Click on the botton Start Streaming Data, there is going to be a lot of stock records
(2) Click on the 3-dotted button on the upper left corner of the graph. The graph is configurable and there are different types of views we can use to visualize the data we have so far.
(3) But we can observe it’s just a bunch of duplicate data being printed for stocks ABC and DEF, instead ofnew data (i.e. different timestamp, ask_price and bid_price for ABC and DEF stocks).
Obejective
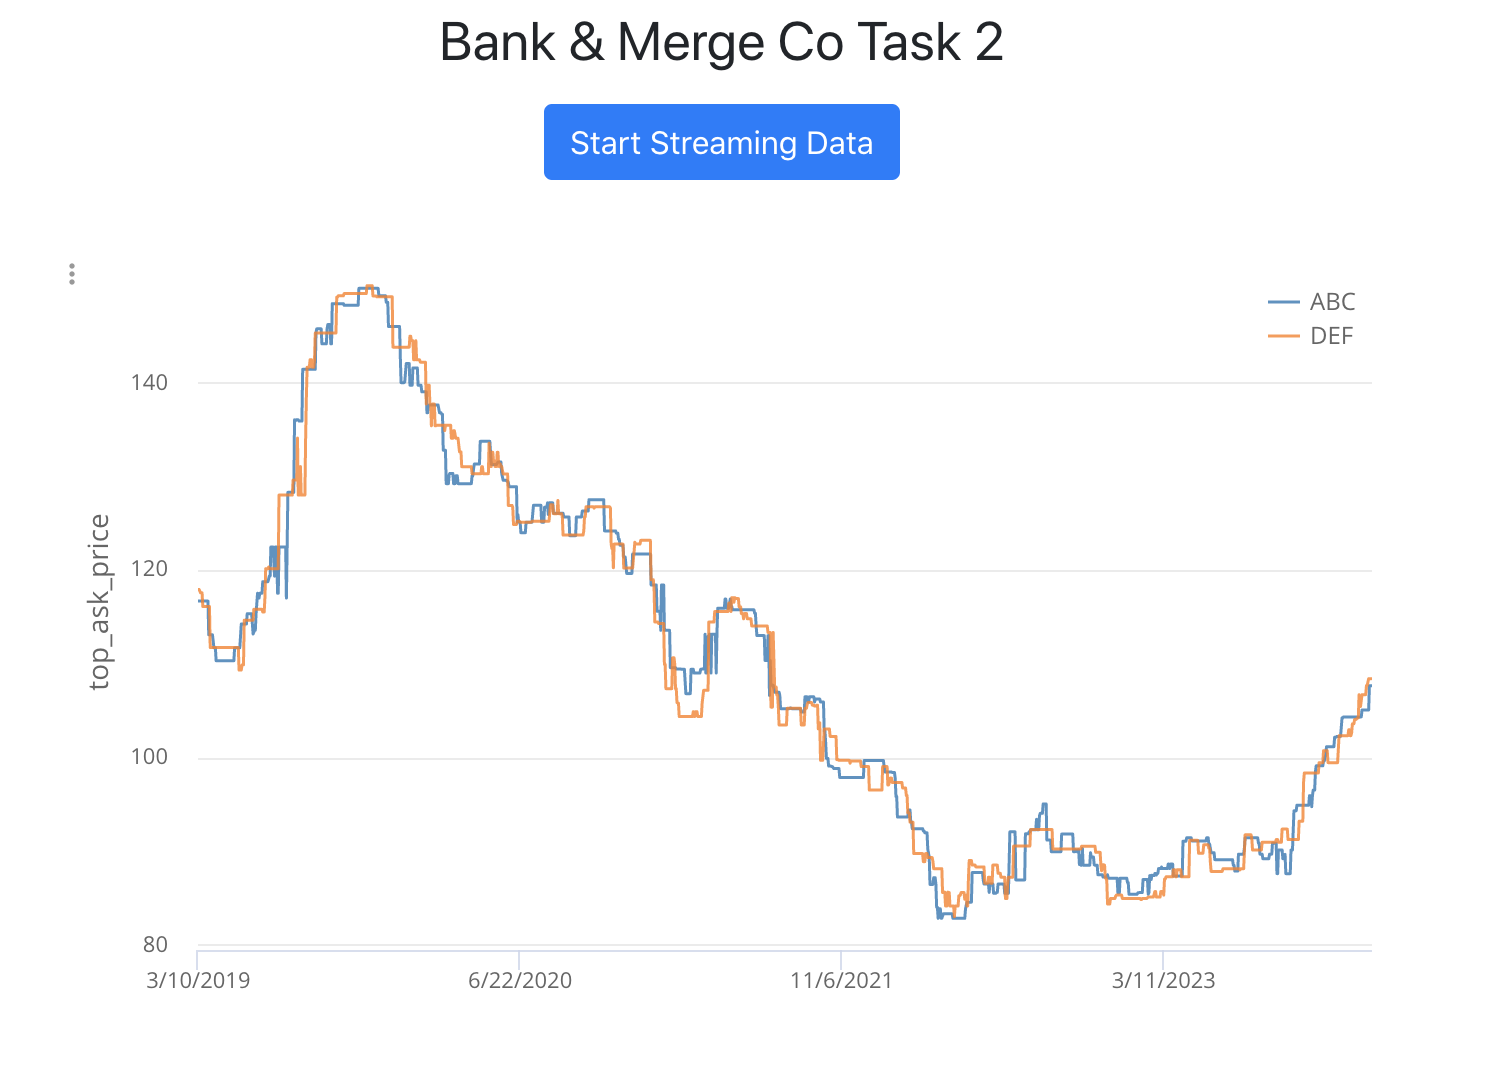
(1) Make the graph continuously update instead of having to click it a bunch of times. Also the kind of graph we want to serve as visual here is kind of a continuously updating line graph whose y axis is the stock’s top_ask_price and the x-axis is the timestamp of the stock
(2) Remove / disregard the duplicated data in ‘first run’
Making changes to the src code
(1) App.tsx, change the static table into a live / updating graph
Declare showGraph and include it in other methods
1 | /** |
To ensure that the graph doesn’t render until a user clicks the ‘Start Streaming’ button, I should also edit the renderGraph method of the App. In there, I must add a condition to only render the graph when the
state’s showGraph property of the App’s state is true.1
2
3
4
5
6
7
8/**
* Render Graph react component with state.data parse as property data
*/
renderGraph() {
if (this.state.showGraph){
return (<Graph data={this.state.data}/>)
}
}
Finally, I must also modify the getDataFromServermethod to contact the server and get data from it continuously instead of just getting data from it once every time you click the button.
Javascript has a way to do things in intervals and that is via the setInterval function. What we can do to make it continuous (at least up to an extended period of time) is to have a guard value that we can check against when to stop / clear the interval process we started.1
2
3
4
5
6
7
8
9
10
11
12
13
14
15
16
17
18
19
20
21
22
23/**
* Get new data from server and update the state with the new data
*/
getDataFromServer() {
let x = 0;
const interval = setInterval(() => {
DataStreamer.getData((serverResponds: ServerRespond[]) => {
// getData() gets the data from the server and when that process is complete
// Update the state by creating a new array of data that consists of
// Previous data in the state and the new data from server
this.setState({
data: serverResponds,
showGraph: true,
// set showGraph to true
// as soon as the data from the server comes back to the requester
});
});
x++;
if (x > 1000){
clearInterval(interval);
}
},100);
}
The line DataStreamer.getData(… => …) is an asynchronous process that gets the data from the server and when that process is complete, it then performs what comes after the => as a callback function.
(2) Graph.tsx
To completely achieve the desired output, we must also make changes to the Graph.tsx file. This is the file that takes care of how the Graph component of our App will be rendered and react to the state changes that occur within the App.
Firstly, enable the PerspectiveViewerElement to behave like an HTMLElement. To do this, I should extend the HTMLElement class from the PerspectiveViewerElement interface.
1 | /** |
Since I’ve changed the PerspectiveViewerElement to extend the HTMLElement earlier, I can now make the definition of the const elem simpler, i.e. I can just assign it straight to the result of the result of thedocument.getElementsByTagName.
1 | /** |
Troubleshoting
Problem:
Failed to Compile-Type Error TS2345
Solution:
in the aggregates property, the value should have been enclosed in back ticks i.e. value,
so it would look somethine like:1
elem.setAttribute('aggregates', `{"stock":"distinct count","top_ask_price":"avg","top_bid_price":"avg","timestamp":"distinct count"}`);
Finished
