Task 3: Display data visually for traders
Use Perspective to create the chart for the trader’s dashboard
Being able to access and adjust data feeds is critical to any trading analysis and stock price monitoring. From the previous tasks, we now have the adjusted data set up on your systems and being piped into Perspective.
For traders to have a complete picture of all the trading strategies being monitored, several screens typically display an assortment of live and historical data at their workstation.
Given there is a lot of information and data being produced at once, visualizing data in a clear manner with UI/UX considerations accounted for is critical to providing traders with the tools to improve their performance.
Setup
Clone Repository1
git clone https://github.com/insidesherpa/JPMC-tech-task-3-PY3.git
Server1
2cd JPMC-tech-task-3-py3
python3 datafeed/server3.py
Client1
2
3
4
5cd JPMC-tech-task-3-py3
nvm use v11.0.0
npm install
npm start
First Run:
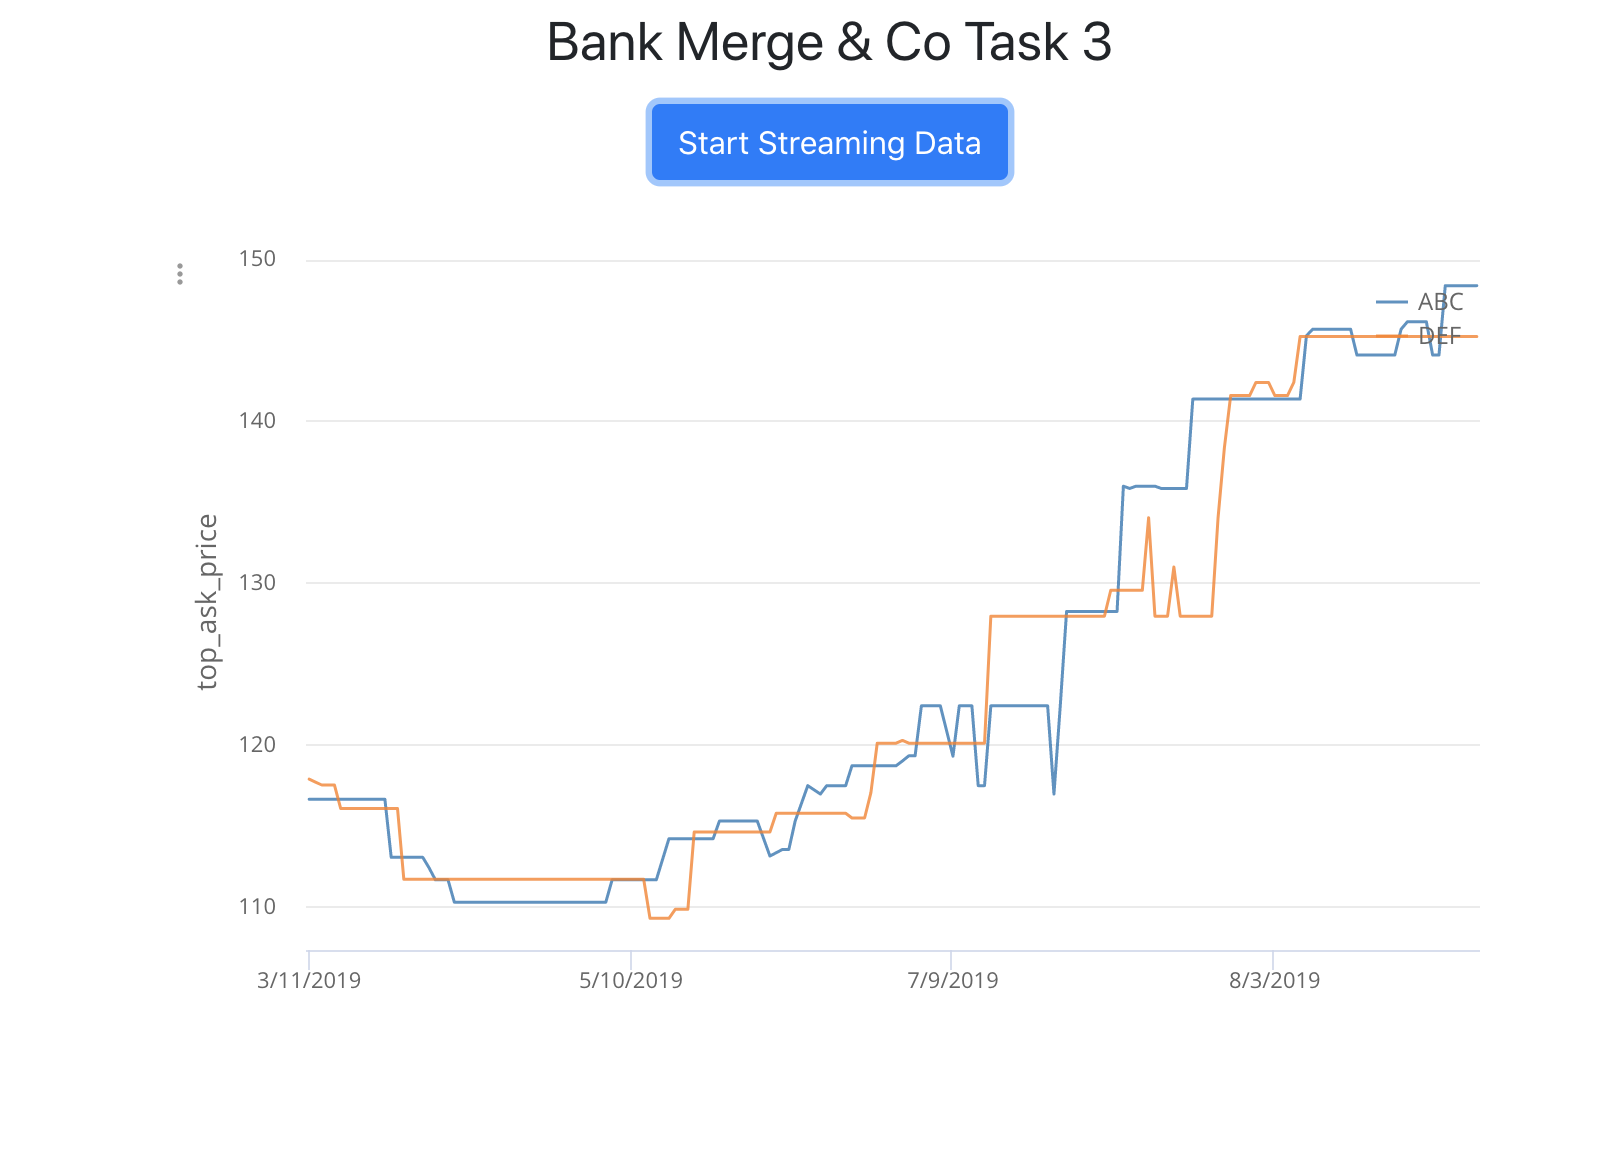
Similar to Task 2, two stocks are displayed and their top_ask_price changes being tracked through a timeline.
Objectives
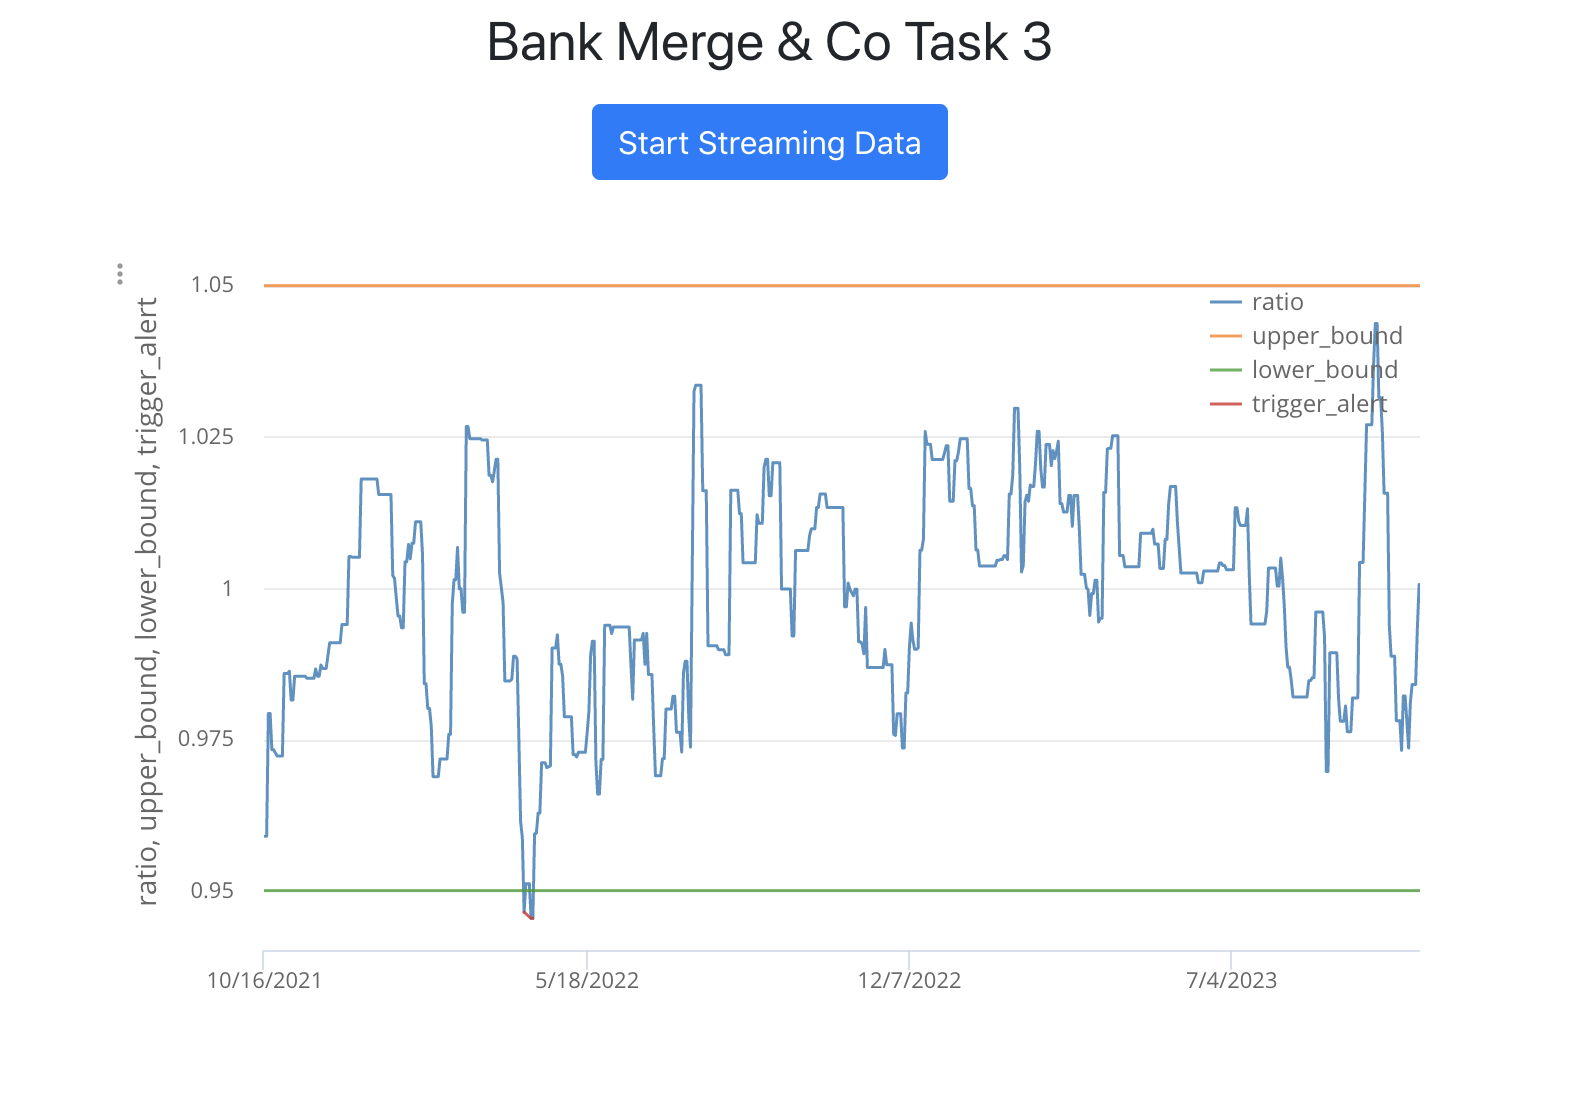
(1) We now want to make this graph more useful to traders by making it track the ratio between two stocks over time and NOT the two stocks’ top_ask_price over time.
(2) As mentioned before, traders want to monitor the ratio of two stocks against a historical correlation with upper and lower thresholds/bounds. This can help them determine a trading opportunity.That said, we also want to make this graph plot those upper and lower thresholds and show when they get crossed by the ratio of the stock
Code Changes
(1) Making changes in Graph.tsx
The changes we’ve made to schema:
- Since we don’t want to distinguish between two stocks now, but instead want to track their ratios, we made sure to add the
ratiofield. - Since we also wanted to track
upper_bound,lower_bound, and the moment when these bounds are crossed i.e.trigger_alert, we had to add those fields too. - Finally, the reason we added
price_abcandprice_defis just because these were necessary to get the ratio as you will see later. We won’t be configuring the graph to show them anyway. - Of course since we’re tracking all of this with respect to time,
timestampis going to be there.
1 | componentDidMount() { |
Make a slight update in the componentDidUpdate method.1
2
3
4
5
6
7
8 componentDidUpdate() {
if (this.table) {
this.table.update([
DataManipulator.generateRow(this.props.data),
]);
}
}
}
(2) Making changes in DataManipulator.ts
The DataManipulator.ts file is responsible for processing the raw stock data we’ve received from the server before it throws it back to the Graph component’s table to render.
Update the Row interface to match the new schema.1
2
3
4
5
6
7
8
9export interface Row {
price_abc: number,
price_def: number,
ratio: number,
timestamp: Date,
upper_bound: number,
lower_bound: number,
trigger_alert: number | undefined,
}
Update the generateRow function of the DataManipulator
class to properly process the raw server data passed to it so that it can return the processed data which will be rendered by the Graph component’s table.
1 | export class DataManipulator { |
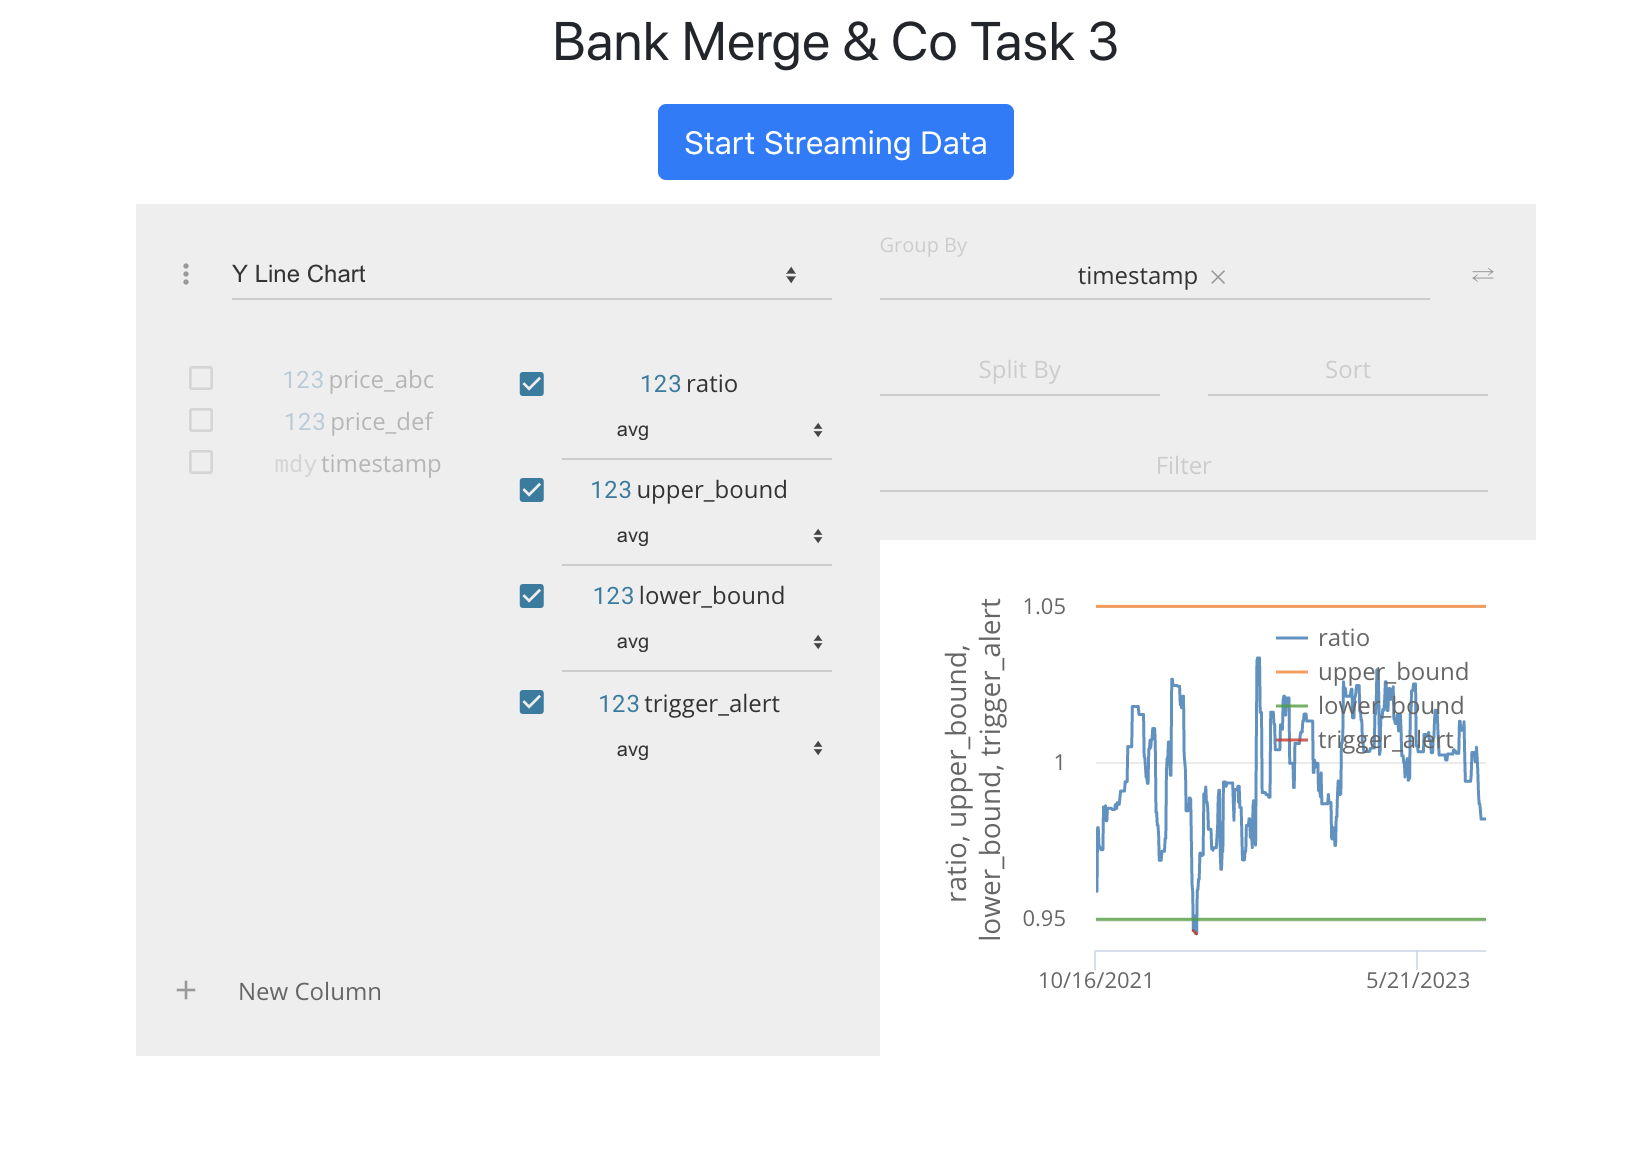
Finished:
with configurations as below: